Data fetching and visualization
Submit a solution
Connect your GitHub account to submit a solution
Community solutions
Bar Chart using Canvas API
Data fetching and visualization
Implemented with React
React solution
Solution using React
Red Bars with Cyan Tooltips
React based solution with css file
Histogram - Vanilla JS Solution
Simple Vanilla JS Solution to render the histogram using Canvas API
Chart Vanilla JS
/
Data fetching and visualization
Vanilla JS
Data fetching and visualization [React]
Data fetching and visualization
Data fetching and visualization by srothst1
Simple solution using react, recoil, and plot.ly. Added a refresh button for fun!
Solved this problem using native javascript
React.js Data fetching and visualization
Created this assignment with the help of React.js, the UI is designed with the help of tailwind CSS. On the button click the graph values get changed and make the UI look better.
Data fetching and visualization using vanilla js
Data fetching and visualization
created using react and recharts lib
Data fetching and visualization
Data fetching and visualization with a button to refetch/regenerate new data, on hovering it can see the the precise value of the number and a form to enter the amount of numbers, the min number and the max number
Vanilla svg solution
I went with SVG because it gives me better control over rendering and manipulation of object
Vanila JS Data fetching and visualization
VanillaJS
Histogram
Data fetching and visualization
used Vanila Javascript
Data fetching and visualization
Histogram
React solution
Made everything dynamic, useEffect to get the values and reduce it to count the freq of all items
react
useState fetch with try catch
Data Fetching & Visualization
Vanilla JS
Data Fetching and Visualization
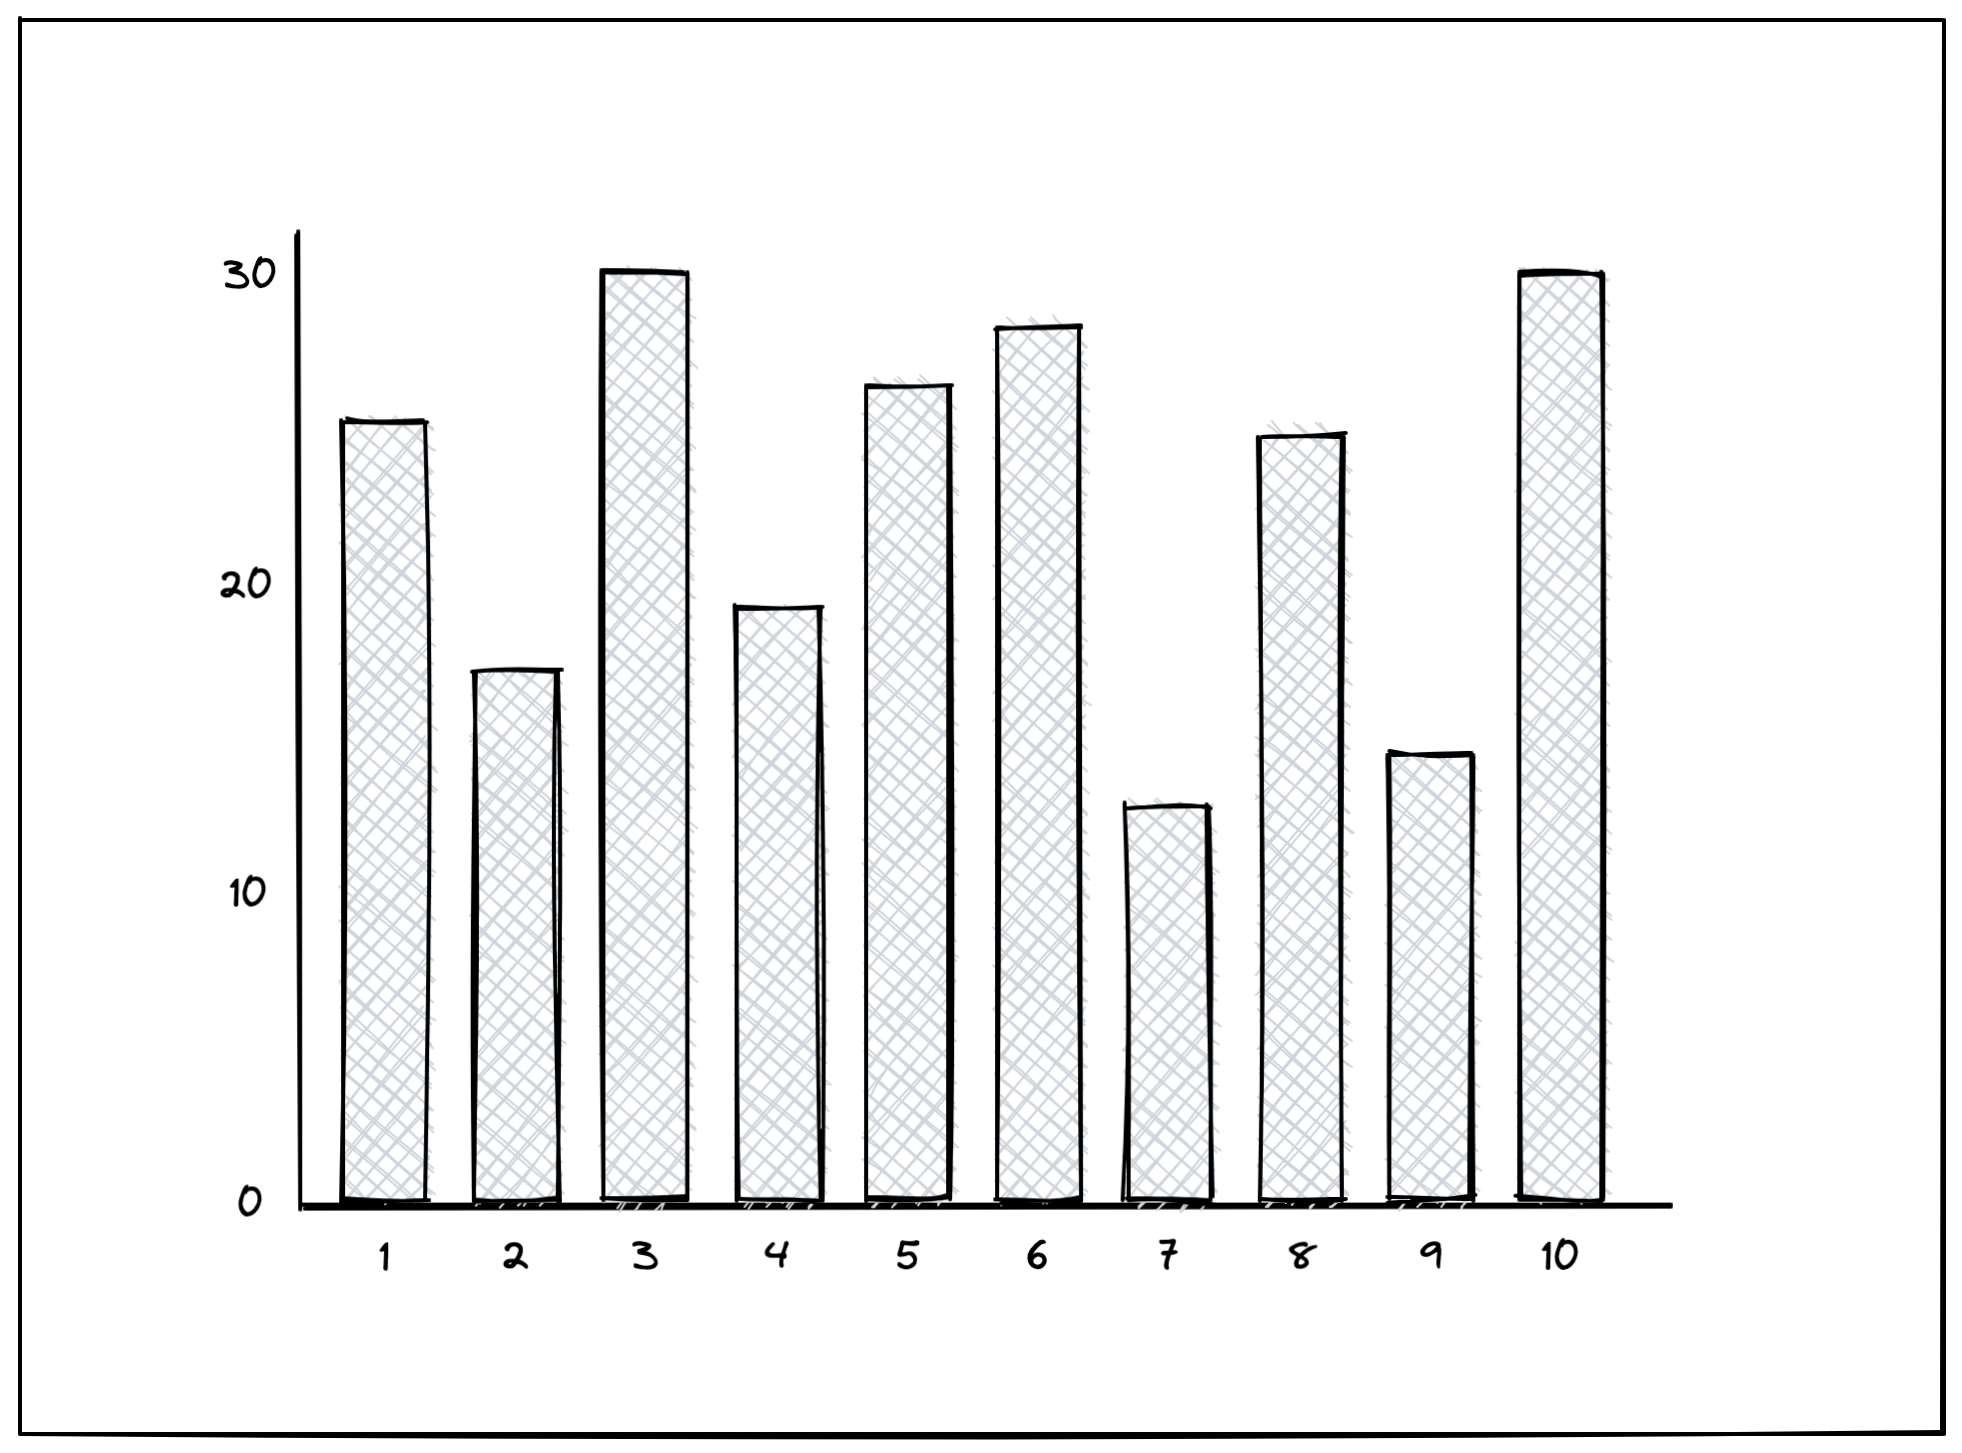
Retrieve a list of numbers from an endpoint, then plot a histogram showing the frequency of each number in the list. The histogram should have appropriately-numbered x and y axes.
[VanillaJS] Async await - position relative/absolute
Solved using Async await - position relative/absolute